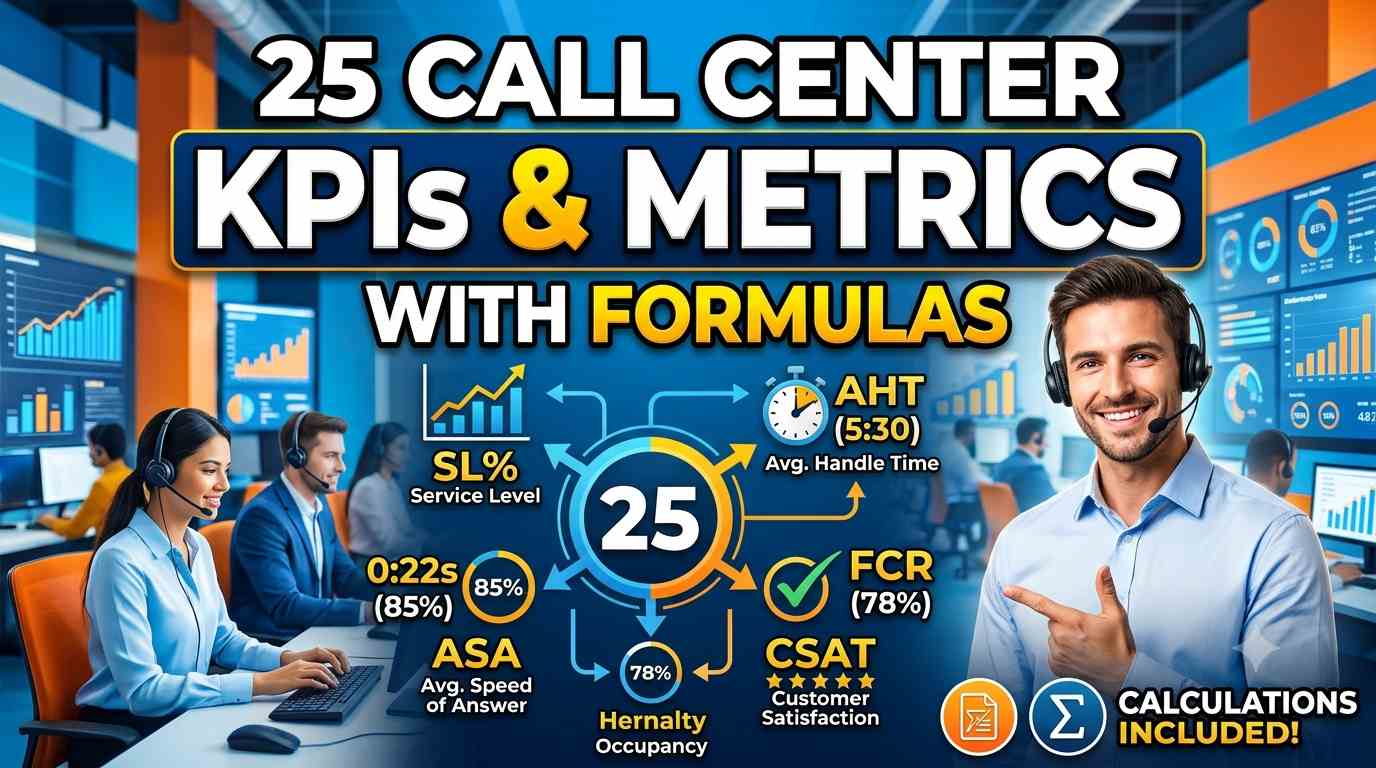

Quick answer: The most important call center KPIs are Average Handle Time (AHT), First Contact Resolution (FCR), Service Level, Average Speed of Answer (ASA), Abandonment Rate, Customer Satisfaction (CSAT) and Agent Occupancy. Together they show three things: how fast you answer, how well you solve problems, and how efficiently your team works. Below you’ll find all 25 KPIs with formulas, worked examples, typical benchmarks and a free calculator.
Every contact center leader eventually asks the same question: “Are we doing well?” Call center KPIs (key performance indicators) answer it with numbers instead of feelings. Track too few and you miss problems. Track too many and nobody knows what matters.
This guide is written from 8+ years of running and designing contact centers on Cisco UCCE, Genesys and Amazon Connect. It covers the 25 contact center metrics that actually matter, grouped by what they measure, with the exact formula for each one.
KPIs vs metrics: what’s the difference?
A metric is any number you can measure, such as total calls today. A KPI is a metric you have chosen as a target because it tells you whether you’re meeting a goal, for example “answer 80% of calls within 20 seconds”. All KPIs are metrics, but not all metrics are KPIs.
Most contact centers pick 5–8 KPIs for daily management and keep the rest as supporting metrics for investigation.
All 25 call center KPIs at a glance
| # | KPI | What it tells you | Typical benchmark* |
|---|---|---|---|
| 1 | Service Level (SL) | % of calls answered within a target time | 80% in 20 seconds |
| 2 | Average Speed of Answer (ASA) | How long callers wait | Under 30 seconds |
| 3 | Abandonment Rate | % of callers who hang up while waiting | Under 5–8% |
| 4 | Average Queue Time | Wait time of all queued calls | Under 60 seconds |
| 5 | Longest Wait Time | Worst-case customer wait | Set per queue |
| 6 | Blocked Call Rate | % of calls that get a busy signal | Under 1–2% |
| 7 | Callback Rate / Scheduled Callbacks | Callers choosing a callback | Track trend |
| 8 | First Contact Resolution (FCR) | % solved on the first contact | 70–75% |
| 9 | Customer Satisfaction (CSAT) | How happy customers are | 75–85% |
| 10 | Net Promoter Score (NPS) | Customer loyalty | Above 30 is good |
| 11 | Customer Effort Score (CES) | How easy it was to get help | Track trend |
| 12 | Quality Assurance (QA) Score | Agent call quality vs a checklist | 85%+ |
| 13 | Repeat Contact Rate | Customers calling back about the same issue | Under 15–20% |
| 14 | Transfer Rate | % of calls transferred | Under 10–15% |
| 15 | Average Handle Time (AHT) | Time spent per contact | 4–7 minutes (voice) |
| 16 | Average Talk Time | Time spent talking | Depends on call type |
| 17 | Average Hold Time | Time callers spend on hold | Under 60 seconds |
| 18 | After-Call Work (ACW) | Wrap-up time after the call | Under 60–90 seconds |
| 19 | Agent Occupancy | % of logged-in time spent handling contacts | 75–85% |
| 20 | Schedule Adherence | Agents working when scheduled | 90–95% |
| 21 | Cost per Contact | What each contact costs | Track trend |
| 22 | Self-Service (Containment) Rate | % resolved by IVR or bot, with no agent | 20–40%+ |
| 23 | Agent Attrition Rate | How many agents leave | Under 30–40% a year |
| 24 | Forecast Accuracy | How close volume forecasts were | ±5–10% |
| 25 | Conversion / Sales Rate | % of contacts that lead to a sale | Depends on industry |
*Benchmarks are common industry starting points, not rules. The right target depends on your industry, channel and customers. A bank fraud line and a retail sales line should not share the same targets.
Speed and accessibility KPIs
1. Service Level (SL)
Service Level is the percentage of contacts answered within a target threshold. It’s the classic headline KPI, usually written as “80/20”: 80% answered within 20 seconds.
Formula: Service Level = (Calls answered within threshold ÷ Total calls offered) × 100
Example: 1,000 calls offered, 820 answered within 20 seconds → 820 ÷ 1,000 × 100 = 82%.
Tip: decide upfront whether abandoned calls count. Many centers exclude calls abandoned in the first 5 seconds (“short abandons”), because those callers misdialled or changed their mind. Write your definition down and keep it consistent.
2. Average Speed of Answer (ASA)
ASA is the average time callers wait in the queue before an agent answers.
Formula: ASA = Total wait time of answered calls ÷ Number of answered calls
Example: 500 answered calls waited 12,500 seconds in total → 25 seconds ASA.
An average can hide pain. A 25-second ASA can still include callers who waited 6 minutes, so pair it with Longest Wait Time (KPI 5).
3. Abandonment Rate
The percentage of callers who hang up before reaching an agent.
Formula: Abandonment Rate = (Abandoned calls ÷ Total calls offered) × 100
Example: 60 abandoned out of 1,000 → 6%.
High abandonment usually means understaffing, a confusing IVR or no callback option. Offering a queued callback is one of the fastest ways to cut it.
4. Average Queue Time
Like ASA, but it includes calls that abandoned, so it shows the full customer waiting experience.
Formula: Average Queue Time = Total queue time of all queued calls (answered + abandoned) ÷ Number of queued calls
5. Longest Wait Time (Oldest Contact in Queue)
The longest time any single caller waited in a period, or the age of the oldest call waiting right now. It’s a real-time alarm: if it climbs past your limit, supervisors move agents or turn on overflow routing.
6. Blocked Call Rate
The percentage of calls that couldn’t even enter the queue: a busy signal, “all lines are busy”, or a queue at capacity.
Formula: Blocked Call Rate = (Blocked calls ÷ Total call attempts) × 100
Cloud contact centers rarely block calls on capacity, but queue size limits and concurrent-call quotas can still cause it.
7. Callback Rate
The share of callers who choose a callback instead of waiting. Track it with Callback Success Rate (callbacks that actually connect) to make sure promises are kept.
Quality and customer experience KPIs
8. First Contact Resolution (FCR)
FCR is the percentage of issues resolved in the first contact, with no follow-up needed. It’s one of the strongest drivers of customer satisfaction and cost: every repeat call costs money and goodwill.
Formula: FCR = (Issues resolved on first contact ÷ Total issues) × 100
Example: 730 of 1,000 customers did not contact you again about the same issue within 7 days → 73%.
How to measure it: the most reliable way is to look for repeat contacts from the same customer (phone number or account) within a set window, often 7 days. A post-call survey question, “Was your issue resolved today?”, is a good second source.
9. Customer Satisfaction (CSAT)
CSAT asks customers to rate their experience, usually 1–5.
Formula: CSAT = (Number of 4 and 5 ratings ÷ Total survey responses) × 100
Example: 340 of 420 responses were 4 or 5 → 81%.
10. Net Promoter Score (NPS)
NPS asks: “How likely are you to recommend us, on a scale of 0–10?” Customers who answer 9–10 are Promoters, 7–8 are Passives and 0–6 are Detractors.
Formula: NPS = % Promoters − % Detractors (ranges from −100 to +100)
Example: 55% promoters, 15% detractors → NPS +40.
11. Customer Effort Score (CES)
Asks “How easy was it to get your issue resolved?”, often on a 1–7 scale. Low effort predicts loyalty better than “delight” does, so CES is great for spotting broken processes such as repeated identity checks or too many transfers.
Formula: CES = Sum of all scores ÷ Number of responses
12. Quality Assurance (QA) Score
Supervisors or AI tools score a sample of contacts against a checklist: greeting, verification, accuracy, empathy, compliance and closing.
Formula: QA Score = (Points scored ÷ Points possible) × 100
Modern platforms can score 100% of contacts automatically. On Amazon Connect, for example, AI features and Contact Lens can transcribe every call and pre-fill evaluation forms.
13. Repeat Contact Rate
The mirror image of FCR: customers contacting you again about the same issue within your window.
Formula: Repeat Contact Rate = (Repeat contacts ÷ Total contacts) × 100
14. Transfer Rate
The percentage of calls transferred to another agent or queue. A high transfer rate usually points to poor IVR routing or agent skill gaps, and customers hate repeating themselves.
Formula: Transfer Rate = (Transferred calls ÷ Total answered calls) × 100
Agent efficiency KPIs
15. Average Handle Time (AHT)
AHT is the total time an agent spends on one contact, from answer to finished wrap-up. It’s the foundation of staffing calculations.
Formula: AHT = (Total talk time + Total hold time + Total after-call work) ÷ Number of calls handled
Example: 100 calls with 30,000 seconds talk, 3,000 hold and 5,000 ACW → 38,000 ÷ 100 = 380 seconds = 6 min 20 s.
Warning: never push AHT down on its own. Agents will rush, FCR will fall, and customers will call back. Always read AHT together with FCR and CSAT.
16. Average Talk Time
Formula: Total talk time ÷ Number of calls handled. Useful for spotting training needs: an agent with much longer talk time than the team on the same queue may need coaching or better knowledge articles.
17. Average Hold Time
Formula: Total hold time ÷ Number of calls placed on hold. Long holds usually mean agents are searching for information. Better knowledge bases and agent-assist tools cut it quickly.
18. After-Call Work (ACW) Time
Wrap-up time spent on notes, dispositions and follow-up tasks after the customer hangs up.
Formula: Total ACW time ÷ Number of calls handled
CRM integration and automatic AI call summaries are the biggest levers for reducing ACW.
19. Agent Occupancy
The percentage of an agent’s available time spent actually handling contacts.
Formula: Occupancy = (Total handle time ÷ (Total handle time + Total available/idle time)) × 100
Example: 6 hours handling, 1.5 hours idle → 6 ÷ 7.5 × 100 = 80%.
Above about 85–90% for long periods, agents burn out. Below about 70%, you’re overstaffed for the volume.
20. Schedule Adherence
Whether agents are doing the right activity at the right time, as scheduled by workforce management (WFM).
Formula: Adherence = (Minutes in the scheduled state ÷ Total scheduled minutes) × 100
Low adherence makes even perfect forecasts useless, because the agents aren’t there when the calls arrive.
Business and cost KPIs
21. Cost per Contact
Formula: Cost per Contact = Total contact center cost ÷ Total contacts handled
Include salaries, platform and telephony, facilities and overheads. Cloud platforms make the technology part easy to see. Our Amazon Connect pricing guide shows how per-minute pricing feeds this number.
22. Self-Service (Containment) Rate
The percentage of contacts fully resolved by the IVR, chatbot or AI agent, with no human involved.
Formula: Containment Rate = (Contacts resolved in self-service ÷ Total contacts entering self-service) × 100
Measure true resolution, not just “didn’t reach an agent”. A caller who gives up in the IVR is not contained; they’re lost. AI agents are pushing containment much higher; see what modern CCaaS platforms offer.
23. Agent Attrition Rate
Formula: Attrition = (Agents who left in the period ÷ Average number of agents) × 100
Contact centers often lose a third or more of their agents each year. Every leaver means hiring and training costs, plus months of lower FCR while new agents learn.
24. Forecast Accuracy
Formula: Forecast Accuracy = 100 − (|Actual volume − Forecast volume| ÷ Actual volume × 100)
Example: forecast 10,000 calls, actual 10,600 → 100 − 5.7 = 94.3%.
25. Conversion / Sales Rate
For sales and retention teams. Formula: (Contacts that led to a sale ÷ Total sales contacts) × 100. Pair it with CSAT so agents don’t oversell.
Free call center KPI calculator
Enter your numbers to calculate the most common KPIs instantly. Everything runs in your browser; nothing is sent or stored.
Note: this calculator treats every unanswered call as abandoned, and FCR is measured against answered calls. Adjust if your definitions differ.
How to build a call center metrics dashboard
A good dashboard answers one question per audience. Keep it focused:
| Audience | Show | Refresh |
|---|---|---|
| Wallboard (agents + supervisors) | Calls waiting, Longest Wait, Service Level today, agents available | Real time (every 5–15 s) |
| Team leader | AHT, FCR, QA score, adherence per agent | Daily |
| Operations manager | Service Level, abandonment, occupancy, forecast accuracy by queue | Daily / weekly |
| Leadership | CSAT/NPS, FCR, cost per contact, containment, attrition | Monthly |
Where the data comes from: every CCaaS platform provides real-time and historical reports. On Amazon Connect you get real-time and historical metrics out of the box. For custom dashboards, stream contact records into a data lake and visualise them in a BI tool such as Amazon QuickSight or Power BI. Our Amazon Connect architecture guide shows where reporting fits in.
Common KPI mistakes to avoid
- Chasing one number. Cutting AHT alone raises repeat calls. Balance speed, quality and efficiency KPIs together.
- Daily averages only. A good daily Service Level can hide a terrible 10–11 am peak. Look at 15- or 30-minute intervals.
- Changing definitions. If “abandoned” or “resolved” means something different each month, your trends are meaningless. Document every formula.
- Ignoring digital channels. Chat, email and messaging need their own targets. A 4-hour email response time and a 20-second voice target are both reasonable.
- Measuring without acting. Every KPI should have an owner and a clear “if it goes red, we do X” action.
Frequently asked questions
What are the top 5 call center KPIs?
For most contact centers: Service Level, First Contact Resolution, Average Handle Time, Customer Satisfaction and Abandonment Rate. Together they cover speed, quality, efficiency and customer outcome.
What is a good AHT for a call center?
It depends on the call type. Simple customer service calls often run 4–7 minutes, while technical support or financial services calls can take 8–12 minutes. Compare against your own history and similar queues, not a single universal number.
What is the 80/20 rule in call centers?
It’s the most common Service Level target: answer 80% of calls within 20 seconds.
What is the difference between call center KPIs and contact center metrics?
Call center KPIs traditionally focus on voice. Contact center metrics cover every channel: voice, chat, email, SMS and social. The formulas are similar, but targets differ by channel.
How do you calculate agent occupancy?
Divide total handle time by the total of handle time plus available (idle) time, then multiply by 100. For example, 6 hours handling and 1.5 hours idle gives 80% occupancy.
Which KPIs matter most for customer satisfaction?
First Contact Resolution has the strongest link to satisfaction, followed by wait time (ASA/Service Level) and customer effort. Solving the problem first time matters more than a fast but unhelpful answer.
Next steps
- Preparing for a contact center role? These KPIs come up in almost every interview. Practise with our contact center interview questions.
- Moving to the cloud? Start with What is CCaaS? and our platform comparison.
- Want to build these reports yourself on Amazon Connect? Our hands-on Amazon Connect training covers real-time and historical metrics, Contact Lens and dashboards.
Join our live, instructor-led Amazon Connect training: 17 modules, 75+ hours, 80% hands-on labs, rated 4.8★ by our trainees. Or test yourself first with our free practice exams.